|

|
|
||||

Growth of Finance, Real Estate and Business Services: Explorations in an Inter-Sectoral Framework
SUKANYA BOSE, Associate Professor, National Institute of Public Finance and Policy, New Delhi, India. email:sukanya.bose@nipfp.org.in
ABHISHEK KUMAR, Research Scholar, IGIDR. email:abhishekk@igidr.ac.in
|
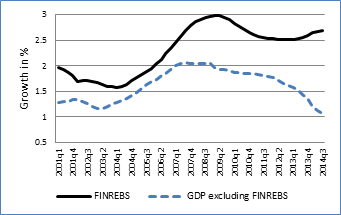
Indian growth experience over the past several decades has been service led. More recently, within services, finance, insurance, real estate and business services (FINREBS for short) has been the fastest growing sector. FINREBS comprises of diverse services that can broadly be clubbed into three components: (i) Banking and insurance; (ii) Ownership of dwellings and real estate; and (iii) Business services. While the first component relates to finance, the second comprises of property and related services, and the third component consists of business services. In 2012-13, banking and insurance comprise 49% of total output of FINREBS. Ownership of dwellings and real estate comprise another 23%, of GDP of FINREBS. Business services which include the fast growing computer services segment contributed 28% of FINREBS output. Graph 1 shows the quarter on quarter rolling growth rate of FINREBS. Beyond the trough of 2004 Q2, growth accelerated continuing way into early 2009. In the subsequent quarters, the sectoral growth may have tempered somewhat, but remains high at 2.5% or more for each quarter. Clearly, FINREBS has maintained a high growth rate even as we see the rest of the economy slowdown. To explore in depth the relationship of FINREBS with the rest of the sectors of the economy is the objective here.
Graph 1: Quarterly Growth Rate (Rolling)*
Source: RBI, Database on the Indian Economy and authors’ calculation. * refers to a rolling period of 20 quarters
Empirical Evidence
Linkage effects provide a useful framework to understand the nature of relationship of FINREBS and other sectors of the economy. The underlying idea is that industries provide the driving forces for the expansion of the system through the input demands (backward linkages) as well as output production (forward linkages) stemming from these activities. A study of input output matrices for the Indian economy for the years 1999-2000, 2003-4 and 2007-8 consistently indicates low linkages of FINREBS with the rest of the economy when compared to most of the other sectors of the economy. Forward linkage from FINREBS to the rest of the economy is below average, and backward linkage from FINREBS is amongst the lowest when ranked vis-à-vis other sectors of the economy. Clearly, FINREBS cannot be a `leading sector’ in the Hirschman sense. Rather FINREBS seems to have developed as an autonomous sector with limited linkages with other sectors of the economy. Input-output analyses further tell that backward and forward linkages from FINREBS have weakened between 2003-4 and 2007-8, the period corresponding to the growth boom in this sector.
Forecast error variance decomposition in VAR framework corroborates the least association of FINREBS with other components of GDP in terms of growth connectedness. Most of the variation in growth of FINREBS is explained by FINREBS itself indicating a strong autonomous element in its growth.
|
Finally, rolling cointegration and causality tests are used to test the evolution of relationship between FINREBS and other sectors, particularly in the recent period for which no input output tables are available. Though again the association of FINREBS with other sectors (mining, construction, trade and transport, and lately manufacturing) is found to be weak, there is one surprising outlier. There’s been an increasing co-movement in output of FINREBS and agriculture and allied activities. Since 2005 the association between agriculture and FINREBS has risen over time and is statistically significant. Causality tests show FINREBS cause agriculture and not the other way round. It appears that agriculture being a supply-constrained sector has benefitted from growing FINREBS although after 2010 the relationship has flattened. For sectors such as manufacturing, mining, construction the relationship with FINREBS essentially is demand determined.
Autonomous growth of FINREBS: Causes and Fallout
Given the preponderance of finance in the composition of FINREBS, dynamics of finance and asset prices determine the nature of growth of the sector. One of the ways in which modern finance has worked is by creating financial booms, credit booms and asset price booms. RBI’s Financial Stability Report (Dec 2013) acknowledges that credit making during 2005 to 2008 boom was associated with less stringent credit appraisal, notwithstanding the regulatory framework. Moreover, even after the slowdown in the rest of the economy, FINREBS continued to grow. Growth in credit to sensitive sectors almost doubled in 2012-13 primarily on account of credit to real estate, whereas in the past, growth in credit to sensitive sectors generally followed a pattern similar to the growth in overall credit.
Other than real estate, the sectors with the highest level of stressed assets in the Indian economy are infrastructure, mining, iron and steel, aviation and textile sectors. Government interference in terms of pushing bank finance into avenues that were better served by long-term industrial financing institutions is said to be a contributing factor. Besides, crony capitalism thrived as firms with low capital base managed to get massive sized loans on the basis of political connections.
As at end March 2015, stressed asset ratio of the commercial banks, defined as the ratio of sum of gross NPAs and restructured standard advances to the gross advances of banks stands at 10.9%. For public sector banks the ratio is 13.2%. Credit growth in the Indian economy has slowed. All scheduled commercial banks credit growth on a year-on-year basis in 2014-15 records 9.7%, whereas the average credit growth for the past ten years between 2004-5 and 2013-14 was around 22%. The health of the banking sector is under serious strain.
Conclusion
The share of FINREBS in India’s GDP has risen to around 22% by 2014 Q3 from 14% around ten years back. The phenomenal growth of FINREBS has essentially been of an autonomous nature. Further, the forces that make for the autonomous characterization of FINREBS are the ones that may push the economy into an unstable financial regime.
|
|
National Institute of Public Finance and Policy • New Delhi, India • URL: www.nipfp.org.in • Tel: +91 11 26569286, 26852398 |

|