
|

|
|
||||

What does the new IIP series tell us about the state of manufacturing in India?
RADHIKA PANDEY, Consultant, NIPFP. email:radhika.pandey@nipfp.org.in
AMEY SAPRE, Consultant, NIPFP. email:amey.sapre@nipfp.org.in
PRAMOD SINHA, Consultant, NIPFP. email:pramod.sinha@nipfp.org.in
|
The 2011-12 base year series of the Index of Industrial Production (IIP) was introduced after a comprehensive revision in the item basket, computation method and data sources. Despite quality improvements, the 2011-12 series has thrown up several new challenges and also has altered our view on the performance of the manufacturing sector. The old IIP series (with 2004-05 base year) showed low and stagnating manufacturing activity, whereas the new series almost entirely reversed the picture by showing sharp upward trends in manufacturing growth. To delve into what the new IIP series inform us about the manufacturing sector, in a recent paper we raise two questions: first, what explains the divergence (or at least a part thereof) between the old and new series, and second, whether the revision has helped improve our understanding of the performance of the manufacturing sector?
Value vs. volume-based commodities
One of the changes in the new series include a higher number of value-based items in the index. In the old series, there were 54 value-based items, while in the new series the number is 109. To get a measure of volume, value-based data are deflated using an appropriate deflator from the WPI (Wholesale Price Index). In terms of numbers, value-based items constitute 25% of the total number of items. These shares are significant enough to bring about a change in IIP (manufacturing). To understand the relative contribution of value versus volume-based items, we classify the manufacturing commodity groups as follows:
Group item is completely volume based: For instance, NIC code 10 – ‘Manufacture of food products’ – has volume-based items with a weight of 5.3025% in the IIP manufacturing index. Interestingly, there are only three categories which are purely volume based.
Group item is completely value based: For instance, NIC code 21 – ‘Manufacture of pharmaceuticals, medicinal chemical and botanical products’ – has value-based items, with a weight of 4.9810% in the manufacturing index.
Group item is both volume and value based: For instance NIC code 29 – ‘Manufacture of motor vehicles, trailers and semi-trailers’ – has a total weight of 4.8573%, of which, 3.5192% is value based and 1.3381% is volume based.
Based on the grouping, we use the individual commodity weights to reconstruct two separate value and volume based indexes. The index can be reconstructed as;
Where Cvai and Cvoi denote value and volume based commodities, and w_vai and w_voi their respective weights at NIC 5 digit level in each industry category. The contribution of each group in the overall growth can be estimated using the following expression
C_g= ((CV-PV)/(PV_I ))
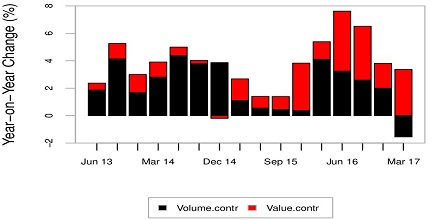
where Cg is the growth of the component (either value or volume), CV is the current period value of the index, PV is previous value and PVI is the previous value of the manufacturing index. Figure 1 shows the contribution of value- and volume-based items in growth of IIP (manufacturing) for each quarter starting from April-June 2013 until January-March 2017.
|
Figure 1: Contribution of value and volume-based items to growth of IIP (manufacturing), April-June 2013 to January-March 2017
We find that the share of value-based items has risen substantially, and is much higher than that of volume-based items since September 2015. The period of rise in the share of value-based items also coincides with the period of divergence between the old and new series. As earlier, the value-based items are to be deflated by WPI to get a measure of production volume. If we map the growth trends of IIP (manufacturing), the period of rise in the index post September 2015 coincides with the fall in the WPI index. We find that the high growth rate of IIP (manufacturing) and hence the divergence with the old series is partly a result of increase in contribution of value-based items and the fall in the WPI deflator between September 2015 and around June 2016.
What does the new IIP series tell us about manufacturing?
A key finding is that the trends of IIP (manufacturing) are now increasingly affected by movements in WPI. The new series is likely to show inflated growth during times of falling inflation suggesting that the sharp rise in the growth of the index need not be on account of actual rise in production volume in industries. The CSO’s press release states that the old and new series are not strictly comparable. Nevertheless, the revision to the new base year has brought new challenges to our understanding of growth in the manufacturing sector. Inclusion of value based items is per-se not a source of problem in building the index. Such items have a subtle reason for being included in the index. However, value based items bring in the role of the deflator which can also influence the growth rates at the commodity level. Thus, deciphering the actual change in production continues to be a difficult task. Finally, what have we learned from the new IIP series? We find that while the revision has improved the quality of the index, its main purpose of capturing volume of manufacturing production has been overshadowed by the nuances of revisions and the technicalities of the index.
Further Reading
CSO, 2017. Revision of Base Year of All-India Index of Industrial production from 2004-05 to 2011-12’, Press Release, Ministry of Statistics and Programme Implementation, Government of India, 12 May 2017.
CSO, 2014. Report of the Working Group for Development of Methodology for Compilation of the All-India Index of Industrial Production with Base Year 2009-10/2011-12’, Ministry of Statistics and Programme Implementation, Government of India, April 2014.
|
|
National Institute of Public Finance and Policy • New Delhi, India • URL: www.nipfp.org.in • Tel: +91 11 26569286, 26852398 |

|