
(Co-authored with R. Kavita Rao)
Banks have been a major source of financing for investment and working capital especially for large firms in India. Changing pattern of resource mobilisation for these firms – with a shift in favour of own resources and the bond market – could have some implications for banks as well. This is an attempt to examine some of the emerging trends and explore likely implications.
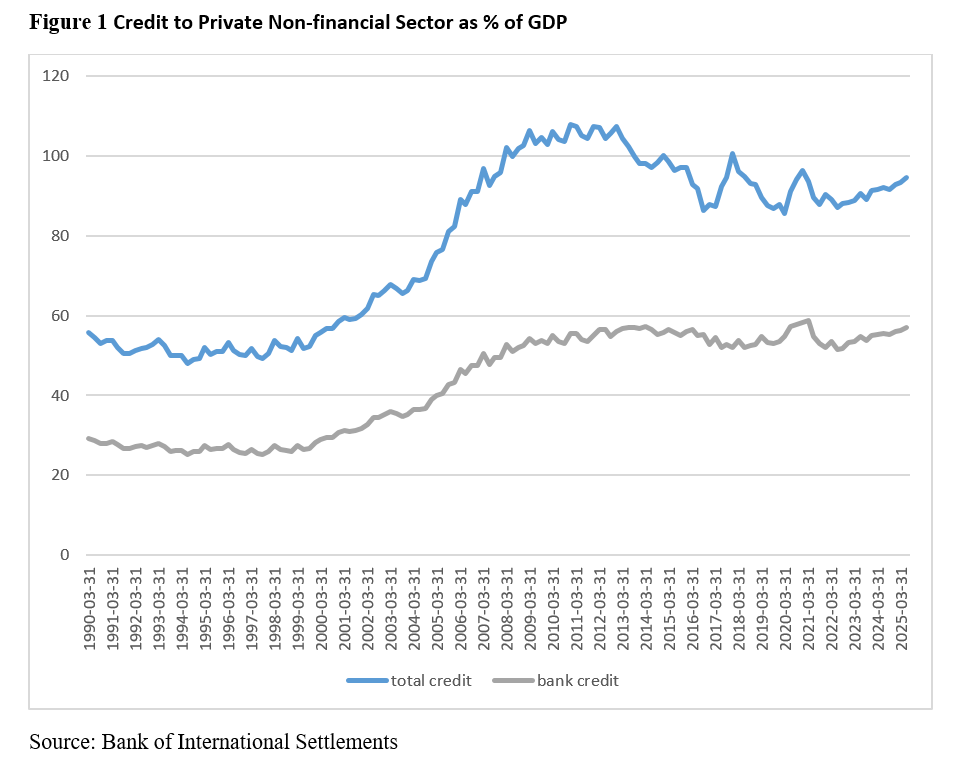
India has witnessed an expansion in bank credit broadly in line with economic expansion in recent years. The ratio of bank credit to gross value added has remained within the band of 53 to 59 per cent during the period 2008 to 2025. This is unlike the decade prior when a consistent growth in credit-GVA ratio was observed. Between 1998-99 and 2008-09, the ratio increased sharply from 25 percent to 53 percent.
Similarly, total credit to private non-financial sector too shows similar patterns, with a fall in levels after 2016. The current levels are at 94 percent for total credit and 57 percent for bank credit.
RBI has argued that there remains scope for India to expand domestic credit, as the private credit to GDP ratio remained below an estimated threshold1. The levels achieved so far is much below the average levels observed for Euro Area, US and China.
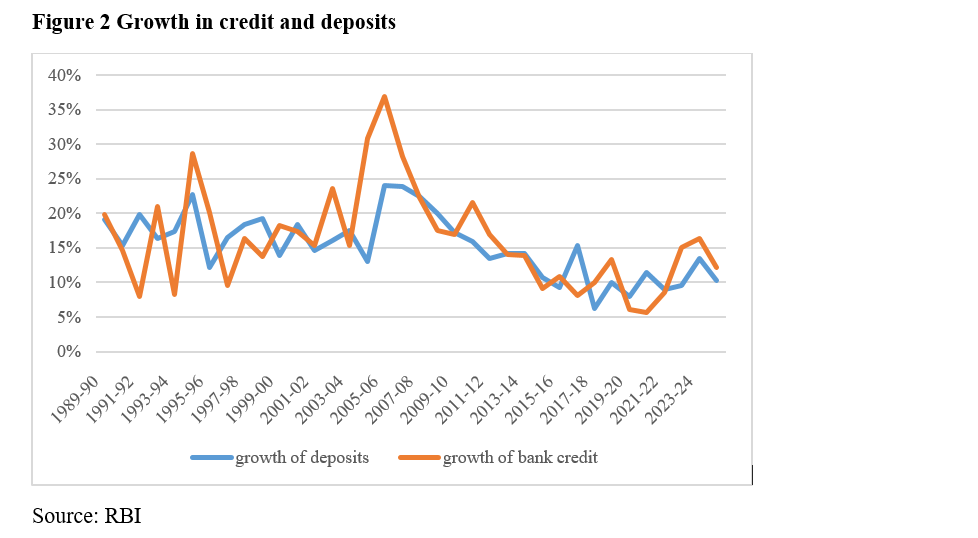
To understand the trends in the ratio of bank credit to GDP, we look at growth of bank deposits and credit. Bank deposits and credit have expanded over the years, reporting double digit growth2. Figure 2 shows that growth in credit has moved in tandem with growth in deposits over the years, more so after inflation targeting was introduced in 2016. An interesting feature, however, is that the rates of growth are lower post 2015, than in the years preceding 2005-06. The average growth rate of credit for the prior period is about 19.9 percent, while that for the latter period is little over 10 percent with higher variation in the former period. It may be noted that these trends post 2015 map on to growth in nominal GDP as well, reflecting in turn as a stable credit to GDP ratio in Figure 1.
The nature of economic growth would have implications for credit growth. In a period where growth in the economy is investment led, demand for credit would be driven largely by firms looking to expand capacity. This could also correspond to increase in the credit to GDP ratio. On the other hand, greater focus on consumption would steer credit to households and entities seeking to finance purchases. Growth in income and growth in credit may be more closely coordinated in such periods implying a stable credit to GDP ratio. Thus the composition of credit matters.
Composition of bank credit can provide some insights into the nature of demand for credit in the country. Non-food credit is broadly classified into five categories – large, medium, small and micro industries, services and personal loans. The two largest recipients of bank credit in 2024-25 are services (28%) and personal loans3 at 32%. Figure 3 tracks the growth of these major categories of loans since 2009. Two interesting points to note: when comparing with the growth of non-food credit, services and personal loans have grown consistently faster since 2017. In contrast, large industries report slower growth during the same period. Medium as well as small and micro industries perform better than large industries but do not consistently match up to the pace of expansion in services or personal loans. The years of slowdown post pandemic were when there was a spike in lending to small and medium enterprises and while the growth settled down after March 2023, they still outpaced large industries.

This in indicative of the shift in nature of borrowers from the banking sector. If services and personal loans outpace the overall loan growth, their share in total loan portfolio would increase. Between 2020 and 2024, the share of services has increased to 25 to 28 percent of outstanding loans while that of personal loans has increased from 27 to 32 percent. Of the services sector, the major share goes to trade (7%), NBFCs (9%) and commercial real estate (2%).
One determinant of credit demand could be incremental capital output ratio. Growth in sectors with high ICOR should result in higher demand for credit without matching increases in growth of economic activity. Industry is known to have a higher ICOR than services. Further, services such as trade should have a lower than average ICOR of services. The relatively higher growth in services sector could perhaps drive some of the observed changes in composition of credit.
Another aspect to consider could be differences in gestation lag. For sectors with low gestation lag, credit should therefore line up with contemporary demand. This could be a description of services sector, especially trade. In other words, credit from banks are perhaps being more focused on current demand rather than on long term investment.
It is likely that large corporations in manufacturing are looking elsewhere for credit. Bonds and debenture issuances have increased in the past year. As per RBI, in 2024-25 a record issuance of 9.9 lakh crore bonds were reported4. Most of these were issued by PSU and NBFCs and 67.1% were in the AAA category. Thus it is possible that going forward entities with relatively lower credit ratings, non-financial corporations and individuals, thus far crowded out of the market, will have more access to bank credit. This in turn could mean that the asset quality and risk faced by the banking sector would have to be monitored closely.
[1] The study estimates this at 113.2 Page 18, 0RTP261220247FFF1F49DFC04C508F300904A90C7439.PDF
[2] Press Releases - Reserve Bank of India
[3] categorised as personal loans which include housing loans, credit card debt, vehicle loans and loans against shares etc.
[4] Page 28, 0FSRJUNE20253006258AE798B4484642AD861CC35BC2CB3D8E.PDF