
|
|
|
||||

Three Decades of India’s Development
SACCHIDANANDA MUKHERJEE, Professor, National Institute of Public Finance and Policy, New Delhi, India. email:sacchidananda.mukherjee@nipfp.org.in
DEBASHIS CHAKRABORTY, Assistant Professor, Indian Institute of Foreign Trade, New Delhi, India. email:debchakra@gmail.com
|
India’s high economic growth has not improved its Human Development Index.
Among Asian neighbours, India’s performance looks modest vis-a-vis Malaysia (62nd), Sri Lanka (73rd), Thailand (89th), China (91st), Indonesia (108th) and Vietnam (121st) in UNDP’s Human Development Index (HDI) 2014. India’s consistent poor performance on HDI front, even after almost three decades of economic liberalization, is not in line with its economic prosperity. For instance, India’s average annual HDI growth was 1.49 percent during 2000-2013 vis-à-vis the corresponding GDP growth figure of 7.09 percent. This raises the question - whether benefits of India’s high economic growth (EG) are reaching a large section of the society or not.
Research suggests that a State-specific HD path is important to augment HD performance at national level.
However, HD performance at national level cannot be improved without augmenting the same at State level and there is need to investigate the weaker EG-HD interrelationship at that sphere. A recent paper by Mukherjee et al. (2014) analyses how the EG-HD nexus has evolved for 28 Indian States over last three decades (1983 to 2011-12), with the help of three composite indicators, namely - inflation and inequality adjusted per capita consumption expenditure; composite indicator on educational attainment and composite indicator on health attainment. The methodology is in line with the National Human Development Report 2001. For each State, the study constructs HDI separately for rural and urban areas. The results underline importance of State-specific HD path and also the presence of high rural–urban disparity.
HD index of high-income States has not necessarily improved.
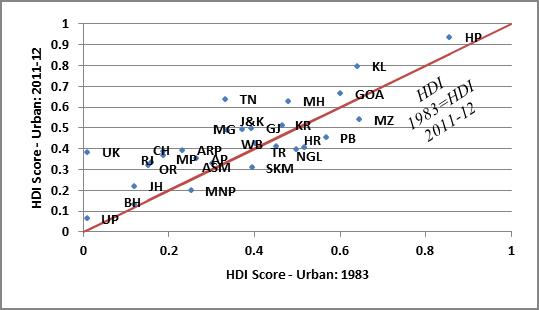
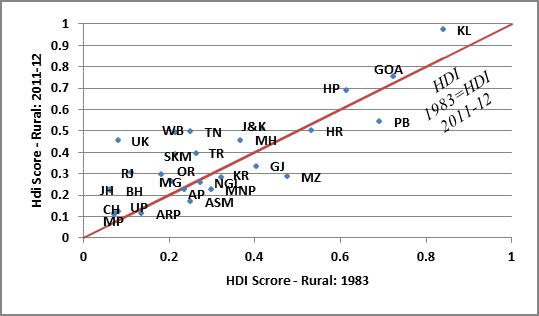
The composite HD index reveals that overall HD level has been consistently high for States like Kerala, Goa, Himachal Pradesh etc., but Chhattisgarh, Uttar Pradesh and Bihar remain among the bottom liners. The HD performance of both high as well as low income States has registered interesting movements. While performance of high income States like Punjab and Haryana have worsened in the urban areas in the recent period, the same has improved for a high-income State Jammu & Kashmir and a middle-income State West Bengal. Non-uniformity in distribution of HD achievements also becomes evident from the analysis. For example, on a rural HDI scale of zero to one, the poorly performing States Chhattisgarh, Madhya Pradesh and Bihar have managed little more than the meagre score of 0.1, while the best performing State Kerala received almost one. Similarly, on an urban HDI scale, Uttar Pradesh has scored less than 0.1, while Kerala and Himachal Pradesh have scored above 0.8. Barring few exceptions, the urban HDI scenario is generally better than the corresponding rural figures for all the periods of analysis.
Rise in per capita income in rural & low-income states augments HD more than it does in urban areas.
The estimated regression results show that - a) PCGSDP is a significant determinant of HD, b) income elasticity of HD is higher for rural areas as compared to urban areas across all income groups and c) income elasticity of HD is higher for lower income States as compared to their higher income counterparts. The absence of significant relationship between PCGSDP and HD in urban areas of middle income states is however an area of concern for policymakers. The results also strongly underlined the positive role of per capita developmental expenditure (PCDE) in augmenting HD across states. |
Fiscal space is a strong determinant of HD in states as it influences PCDE to a large extent.
The results show that low-income States are largely dependent on their own-tax revenue to finance their developmental expenditure as compared to their higher income counterparts. Two important issues follow in this context. First, all States are not equally capable to generate their own resources due to their locational disadvantages (e.g. hilly terrains). Second, all states are not equally dependent on their own resources to finance their developmental expenditures. For non-special category States, the association between fiscal space and PCDE is higher for middle income States as compared to their low and high income counterparts. Similar association is observed for special category States as well.
The Figures indicate that the States placed below the diagonal line have experienced negative HDI growth over 1983 to 2011-12, while those lying above the diagonal have registered positive performance during the same period.
The non-uniform distribution of HD achievements across rural and urban areas of a single State also becomes evident from the diagrammatic representation.
Policy conclusions:
Reference
Mukherjee, Sacchidananda, Debashis Chakraborty and Satadru Sikdar (2014), “Three Decades of Human Development across Indian States: Inclusive Growth or Perpetual Disparity?” Working Paper No. 2014-139, National Institute of Public Finance and Policy, New Delhi. |
|
National Institute of Public Finance and Policy • New Delhi, India • URL: www.nipfp.org.in • Tel: +91 11 26569286, 26852398 |

|